Highlighted below are the definitions for seven of our Key Performance Indicators (KPI) describing how they are measured and why. This is essential to understanding what changes can be made in order to improve performance. Click on the indiviual reports for more detailed information or return to the homepage to view the snapshot.
KPI-01 / Monthly Ridership
Ridership is one of the most common measurements for transportation performance. Monthly ridership is measured by the number of passengers who take a single trip on a bus or Trolley. For example, if a passenger takes a trip to work on a bus, then takes a trip home on a bus, this is counted as two trips towards MTS monthly ridership. Or, if a passenger gets to work by taking a trip on a bus, then transfers to the Trolley for a trip, this also counts as two trips.
Why is this important? Tracking ridership is important because it helps MTS understand trends in transportation so we can make the best system adjustments. We also need to document ridership information for quarterly and annual state and federal reporting requirements. If we know what trends impact ridership, we have a better understanding about how to adjust. Examples of internal influences impacting ridership are route reconfigurations, service increases, schedule shake ups, operator training, fare adjustments and publicity. Examples of external trends contributing to ridership fluctuations are unemployment rate, hourly wages, road construction and long-term regional planning decisions.
KPI category: Productivity/Efficiency
KPI-02 / Passengers Per Revenue Hour
Passengers per revenue hour measures the average number of passenger boardings on an MTS bus or Trolley for every hour of service that a vehicle is on the rail or road. This metric includes layover, and excludes pull and deadhead hours. At the end of each day the number of passengers are tallied and divided by the total number of hours the bus or Trolley was on the rail or road.
Why is this important? The measurement allows MTS to gauge the productivity and effectiveness of our service by providing a good comparison across routes (or modes) of differing levels of service. It also helps us adjust the frequency of service to match demand.
KPI category: Productivity/Efficiency
KPI-03 / Farebox Recovery and Subsidy
Farebox Recovery is the percent of total operating costs recovered through fare revenue paid by passengers. It is calculated by dividing total cash fares and pass sales revenue by the total operating expenses. For example, MTS's farebox recovery for fixed-route bus can be broken down as follows (based on FY 2014 figures):
Fare revenue per passenger: $1.05
Operating cost per passenger: $2.73
Fare revenue / Operating Cost = 38.3%
The 38.3% farebox recovery rate for fixed-route bus can be increased by generating more revenue or decreasing costs.
Why is this important? This measurement is popular with decision-makers because it highlights a transit system's ability to maximize ridership while being efficient in other areas like maintenance, procurement of goods and services, grant acquisitions and customer service. The higher the farebox recovery rate, the less we have to depend on other sources of funding to keep us in business. MTS has one of the highest farebox recovery rates in the nation. We work hard to get this measurement as high as possible.
KPI category: Productivity/Efficiency
KPI-04 / On-Time Performance
On-Time Performance (OTP) refers to the level of success of the bus and Trolley remaining on the published schedule. Departure is considered on-time if made between zero and 5 minutes after a scheduled departure time. MTS Trolley follows national standards and measures OTP based on the departure time at one end and the arrival time at the other end of the line. MTS Bus measures OTP based on departure times at each timepoint along a route. Many factors affect bus OTP. Some are within MTS control such as mechanical or operator issues. Others, such as traffic, construction or unplanned detours, are not.
Why is this important? If MTS is not timely with our delivery of services, riders will look for other options to get where they need to go. OTP is a reflection of the dependability of our system to meet the needs of our passengers.
KPI category: System Performance
KPI-05 / Complaints per 100K Passengers
Complaints Per 100K Passengers count the number of customer complaints received about MTS Bus or Trolley service per 100,000 passenger trips. When customers call MTS with a comment, a customer service representative determines if the comment is potentially a chargeable complaint to an operator. If it is deemed a complaint, then the information is sent to someone within that department for further investigation. At that point, if the investigator determines the call as a legitimate complaint, it is registered as part of the Complaints Per 100K Passengers total.
Why is this important? Tracking complaints allows us to understand how MTS employees and customers are interacting and how our services are performing. It is important to identify the reasons for complaints against MTS employees and MTS services so we can realize the circumstances and use each situation as a learning tool to improve.
KPI category: System Performance
KPI-06 / Mean Distance Between Failures
Mean Distance Between Failures is the average distance (measured in total service miles) between mechanical failures of an MTS Bus or Trolley. This includes a failure of some mechanical element of the vehicle that prevents the vehicle from completing a scheduled revenue trip or from starting the next scheduled revenue trip because actual movement is limited, because agency policy requires a vehicle to be removed from service, or because of safety concerns.
Why is this important? Measuring the distance between failures is important because it helps us understand the health of our vehicle fleet. The goal of our maintenance departments is to increase the distance between failures so that our reliability of service is the highest possible. Any time our in-service vehicles have maintenance issues it has a ripple effect throughout the entire system, and impacts other KPIs such as Complaints Per 100K Passengers and On-Time Performance.
KPI category: System Performance
KPI-07 / Preventable Accidents per 100K Miles
A preventable accident can be defined as one in which the operator failed to do everything that he/she reasonably could have done to avoid the accident. Additionally, a preventable accident is one in which the operator has some responsibility for failing to prevent, contributing to, or causing an accident. Preventable accidents include MTS Buses and Trolleys that are in service or out of service.
Why is this important? Safety is the number one priority at MTS and preventable accidents are taken very seriously. We measure the number of preventable accidents to better understand why accidents happen and how we can prevent them in the future. Learning from these accidents helps us improve operator training methods, alter bus routes, and also help us find the safest routes to take. MTS operators are professional drivers, therefore we are held to a higher standard than non-professional drivers. A professional driver is expected to take all reasonable actions to prevent accidents and overcome the mistakes of other drivers.
KPI category: System Performance

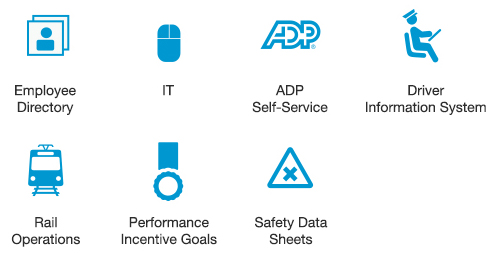
 Employee Directory
 IT Help Desk
 ADP Self-Service
 Driver Information System
 Bus Operations
 Rail Operations
 Performance Incentive Program
 Safety Data Sheets


