You are here
17
Apr
KEY PERFORMANCE INDICATORS
Our Key Performance Indicators are on pace with last year’s effort at the halfway point. There are areas for improvement, as only six out of 10 measures are better than last year. Six months to go!
Accomplishments:
- Nine out of 10 performance measures for MTS Bus and Trolley are within 95% of last year’s totals.
- MTS Maintenance Departments for both Bus and Rail continue their great work. MTS Bus has improved miles between bus breakdowns by 1,500 miles over last year. MTS Trolley has improved by 2,600 miles.
- On-Time Performance for MTS Bus (All Routes) is performing slightly better than last year at 82.6%. And at 93.3%, MTS Rail is also edging last year’s on-time performance.
Challenges:
- Ridership has been the biggest challenge to our KPIs the past two years. Some outside influences, such as the economy and increased auto use have not helped. But internally, we are making major enhancements to the bus system to better meet market demand. Over the next 12 months, we hope to see better ridership results from this strategy.
- Preventable Accidents Per 100K Fleet Miles ticked up for MTS Trolley – jumping from 0.17 last year, to 0.31 this year. However, Trolley operations just posted an accident-free month, so things are turning around!
News Category:

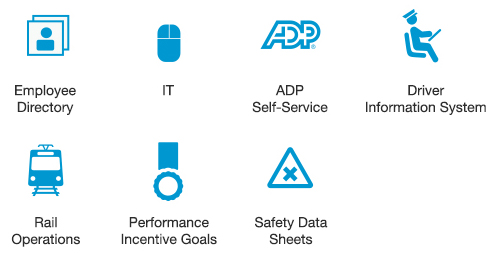
 Employee Directory
 IT Help Desk
 ADP Self-Service
 Driver Information System
 Bus Operations
 Rail Operations
 Performance Incentive Program
 Safety Data Sheets


