You are here
KEY PERFORMANCE INDICATORS FY17 - March
With KPI information now on record for nine months of FY 2017 (July 2016-June 2017), we can make some solid predictions on our annual performance. Here are a few highlights:
ACCOMPLISHMENTS:
- Both MTS Rail and Bus are surpassing the goals for Preventable Accidents per 100K Miles.
- Complaints per 100K Passengers are performing very well. Complaints are reduced from 4.2 complaints last year to 3.7 complaints this year.
- At 80.9%, MTS Bus On-Time Performance is narrowly beating last year’s mark of 80.7%. Let’s see if the MTS Bus team can hold on to this accomplishment.
- Maintenance is showing its muscle! Both MTS Bus and Rail have reduced Mean Distance Between Failures and are exceeding the goals by more than 500 miles combined!
CHALLENGES:
- After years of growing ridership, System Ridership has decreased the last two years. With 66 million riders through nine months, MTS is on track to log approximately 88 million riders in FY 2017.
- In connection with lower ridership, Passengers per Revenue Hour is also down for both MTS Bus (from 24 to 20) and Rail (from 231 to 212).
To meet the challenges our system is experiencing with ridership, MTS Planning has embarked on the Transit Optimization Plan – a thorough analysis that will provide the Board of Directors with recommendations in July for improving the efficiency and performance of our system. MTS also launched the Compass Cloud mobile ticketing app, and is about to launch stored value for Compass Cards to encourage more riders

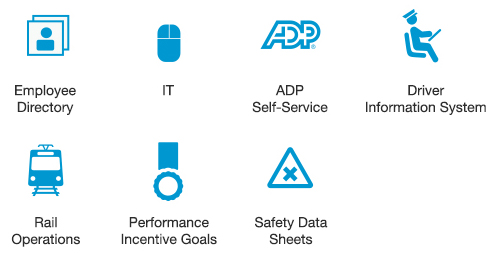
 Employee Directory
 IT Help Desk
 ADP Self-Service
 Driver Information System
 Bus Operations
 Rail Operations
 Performance Incentive Program
 Safety Data Sheets


