You are here
18
Jul
KEY PERFORMANCE INDICATORS FY18 - Jan - March
Our Key Performance Indicators are at a near-pace of last year’s effort. There are areas for improvement, as only four out of 10 measures are better than last year.
ACCOMPLISHMENTS:
- MTS Maintenance Departments for both Bus andTrolley continue to lead the pack. Between the two modes, milkes driven breakdowns have increased by 2,500 miles for Trolley and 1,600 miles for Bus.
- On-Time Performance has been great. Both modes aare outpacing last year's effort, which is important because reliability of service is one of the top priorities for passengers.
- Trolley has accident-free months in December and February
- While ridership is down over the last year, it's still within 95% of last year's total through the first eight months. Additionally, far revenue remains at last year's pace.
CHALLENGES:
- Preventable Accidents Per 100K miles for both Bus and Trolley are higher than last year's total at 1.19 and 0.23 respectivley.
- Passengers perRevenue Hour have dipped below last year's benchmark at 21.8 for Bus and 220.1 for Trolley. This is a direct reflection of the ridership losses we've experienced.
News Category:

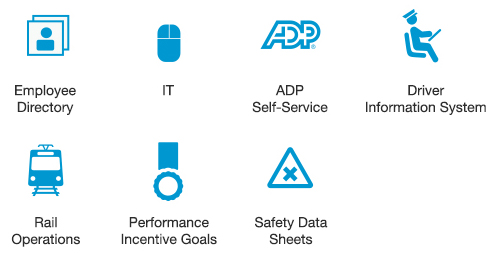
 Employee Directory
 IT Help Desk
 ADP Self-Service
 Driver Information System
 Bus Operations
 Rail Operations
 Performance Incentive Program
 Safety Data Sheets


